Phylo traits
In this tutorial you measure phylogenetic signal in body_mass. You then try the other three cards in the Phylo traits module: PGLS, Pagel’s correlation and PGLM.
The bundled example is synthetic. Its values are invented and its branch lengths are arbitrary. Results are a demonstration, not biological evidence.
Before you start
Open Phylo traits, then its Data card. Load the example and click Use matched taxa. Resolve the mismatch shows each step.
Phylogenetic signal
This card asks whether species’ values resemble those of their relatives more than expected under the reference tests. It reports Blomberg’s K, with a randomization test, and Pagel’s λ.
- Open the Phylogenetic signal card.
- Set Trait for signal to
body_mass. - Leave K test draws (including observed) at 999 for a first pass.
- Click Run signal analysis.
- In Results, read Blomberg’s K and Pagel’s λ. The tree shows observed tip values.
- Open Diagnostics to see the randomized K distribution.
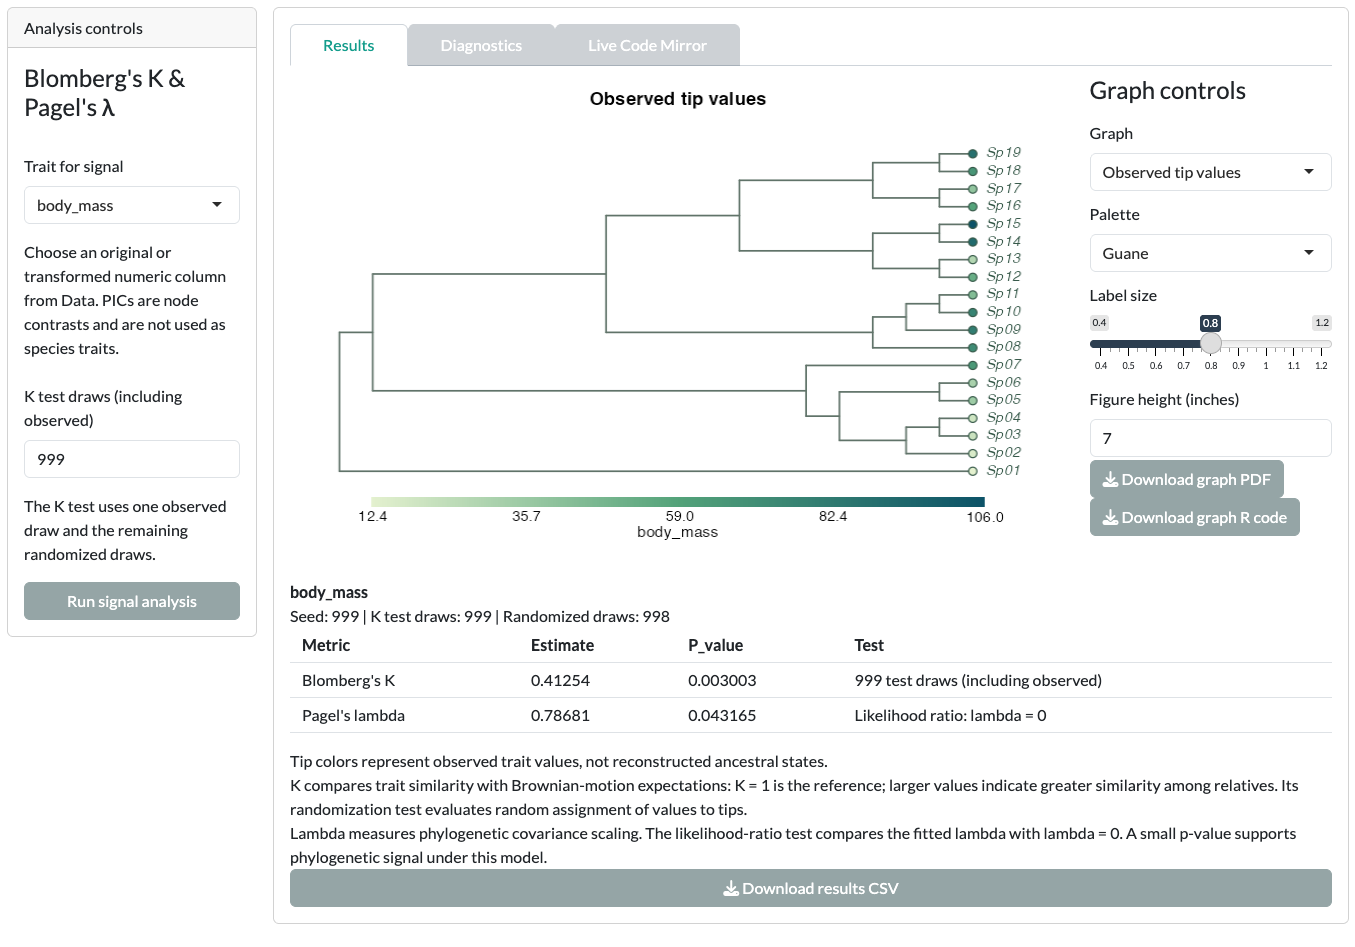
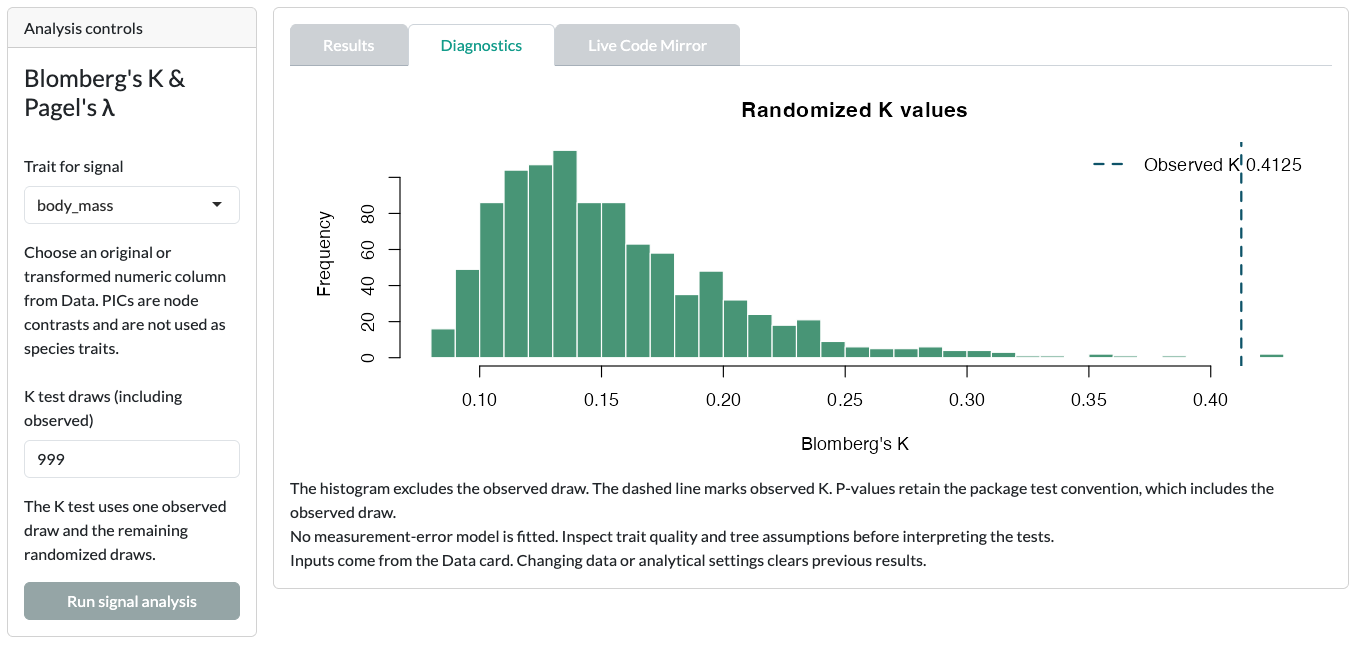
The randomization uses the Seed from the Data card, so you can repeat the same run.
Rerun on the log scale
- In the Data card, create
body_mass_logas shown in Check and transform a trait. - Return to Phylogenetic signal and set Trait for signal to
body_mass_log. - Click Run signal analysis again.
The log scale is a different measured scale, so K and λ can change. The original body_mass column stays unchanged.
Save the script and graph
Under Graph controls, choose the Graph and its appearance. Click Download graph R code for a standalone R script that reruns the K and λ tests and redraws the graph. Download graph PDF is under Graph controls; Download results CSV is under the results table.
PGLS
PGLS fits a continuous response against one or more numeric predictors, allowing for phylogenetic covariance. This card needs an ultrametric tree; the example tree is ultrametric.
- Open the PGLS card.
- Set Response to
body_massand addtemperatureunder Predictors. - Choose a Correlation structure: BM, Grafen, Pagel or Blomberg.
- Click Run PGLS.
- In Results, read the coefficients. Switch Graph between Observed versus fitted, Coefficient intervals and Residual diagnostics.
- Optionally, click Compare covariance models (ML). It fits the four structures by ML on the same data.
Do not rank REML fits with different fixed effects as if their likelihoods were comparable. An association is not proof of causation.
Pagel’s correlation
This card runs Pagel’s 1994 test of correlated evolution between two binary traits. It compares an independent model with a dependent one. It is not a regression.
- Open the Pagel’s correlation card.
- Set Binary trait X to
habitat_binaryand Binary trait Y toparental_care_binary. - Click Run Pagel’s correlation.
- In Results, set Evolution model to Dependent evolution to see the transition diagram.
- Check Diagnostics for convergence and joint state counts.
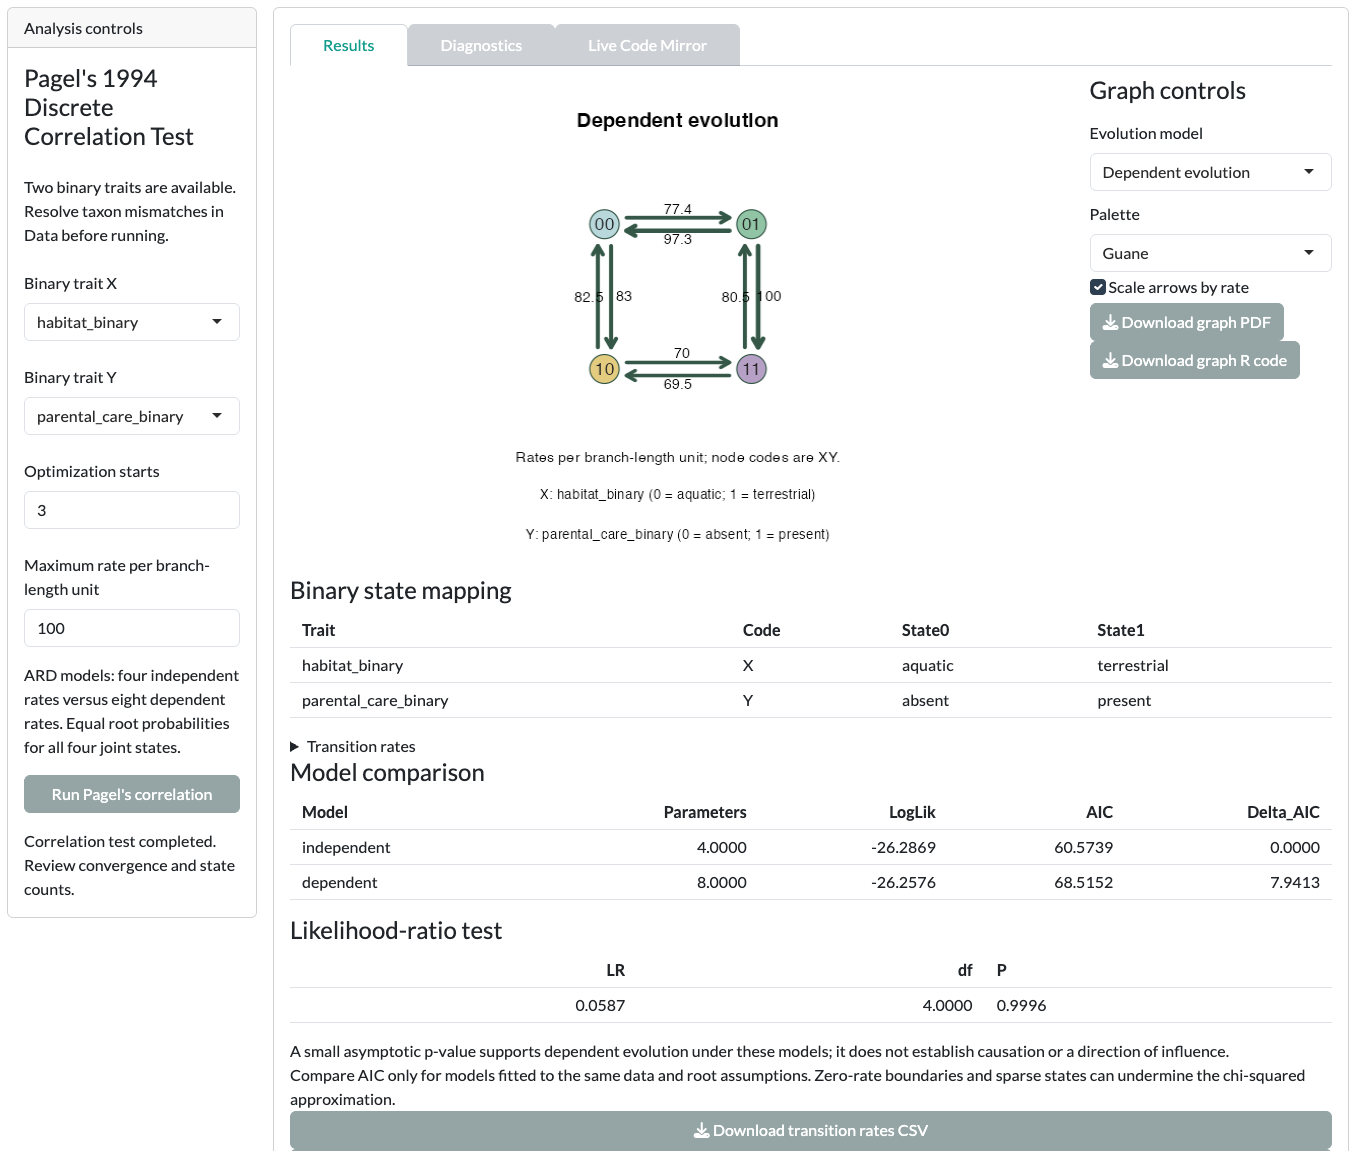
With the synthetic example, expect a likelihood-ratio P value close to 1. The dependent model is not supported. The diagram shows what the dependent model fitted; it is not evidence of correlated evolution. A small dataset with few taxa per joint state is often weakly informative.
PGLM
PGLM relates a non-Gaussian response to predictors, allowing for phylogenetic structure. The card supports binary, count and grouped-binomial responses.
- Open the PGLM card.
- Set Response family to Counts (Poisson GEE / log).
- Set Response / successes to
offspring_count. - Add
body_massandtemperatureunder Predictors. - Click Run PGLM.
- After the fit, click Run taxon influence diagnostics to see how much each species affects the result.
To try the grouped-binomial family, set Response family to Grouped binomial (GEE / logit). Set Response / successes to success_count and Total trials to trial_count. Trials are a count, not a predictor or an offset.
If a predictor is categorical, mark it under Categorical predictors and choose its reference category. Count and grouped-binomial GEE fits have no likelihood-based AIC comparison.
Before you interpret
- A significant signal test does not identify the process that caused the pattern.
- Trait normality does not establish normal model residuals. PICs are node contrasts, not species traits.
- Pagel’s correlation depends on state coding and a fixed tree. GEE fits have no AIC comparison.
Read Phylogenetic signal and PGLS and Pagel’s correlation and PGLM before you report.
Next step
Change the controls beyond the defaults in Advanced phylo traits.