Example data and the Data card
Every tutorial starts here. On this page you load the bundled example, find the deliberate mismatch between tree and table, and resolve it. You also create a transformed trait column.
The bundled example is synthetic. Its values are invented, and its branch lengths are in arbitrary units, not ages. Results from it are a demonstration, not biological evidence.
The example files
Guane ships two files. Load example data reads them; it does not generate new data each time.
guane-example-tree.nwk: a rooted, bifurcating, ultrametric tree with 20 tips,Sp01toSp20. Its branch lengths are in arbitrary units (Grafen-scaled, total height 1), not ages.guane-example-traits.csv: a trait table with 19 rows,Sp01toSp19.
Sp20 has no row in the table on purpose. It lets you practise finding and resolving a mismatch.
Column dictionary
| Column | Type | Meaning or states | Example use |
|---|---|---|---|
species |
Identifier | Exact tree tip label | Taxon column |
body_mass |
Continuous | Example mass in grams | Signal, PGLS, continuous reconstruction, QuaSSE |
body_length |
Continuous | Example length in centimetres | Signal, PGLS |
temperature |
Continuous | Example temperature in degrees Celsius | PGLS and PGLM predictor |
habitat_binary |
Discrete, 2 states | terrestrial, aquatic | Pagel’s correlation, BiSSE, hidden-state models |
parental_care_binary |
Discrete, 2 states | absent, present | Pagel’s correlation |
locomotion_3state |
Discrete, 3 states | walking, swimming, flying | Discrete reconstruction, MuSSE |
diet_5state |
Discrete, 5 states | herbivore, carnivore, omnivore, insectivore, frugivore | Discrete reconstruction, MuSSE |
resource_use_polymorphic |
Polymorphic | fruit, seed, insect, and combinations joined by + |
Polymorphic reconstruction |
offspring_count |
Count | Invented nonnegative integer counts, including zeros | Count PGLM |
success_count |
Count | Invented number of successful trials | Grouped-binomial PGLM (successes) |
trial_count |
Count | Total attempts for that species | Grouped-binomial PGLM (trials) |
A value such as fruit+seed means the species shows both states at once. It does not mean uncertainty or a missing value. Guane never turns a multistate trait into a binary one for you.
Load and inspect
- Open a module, for example Phylo traits, and open its Data card.
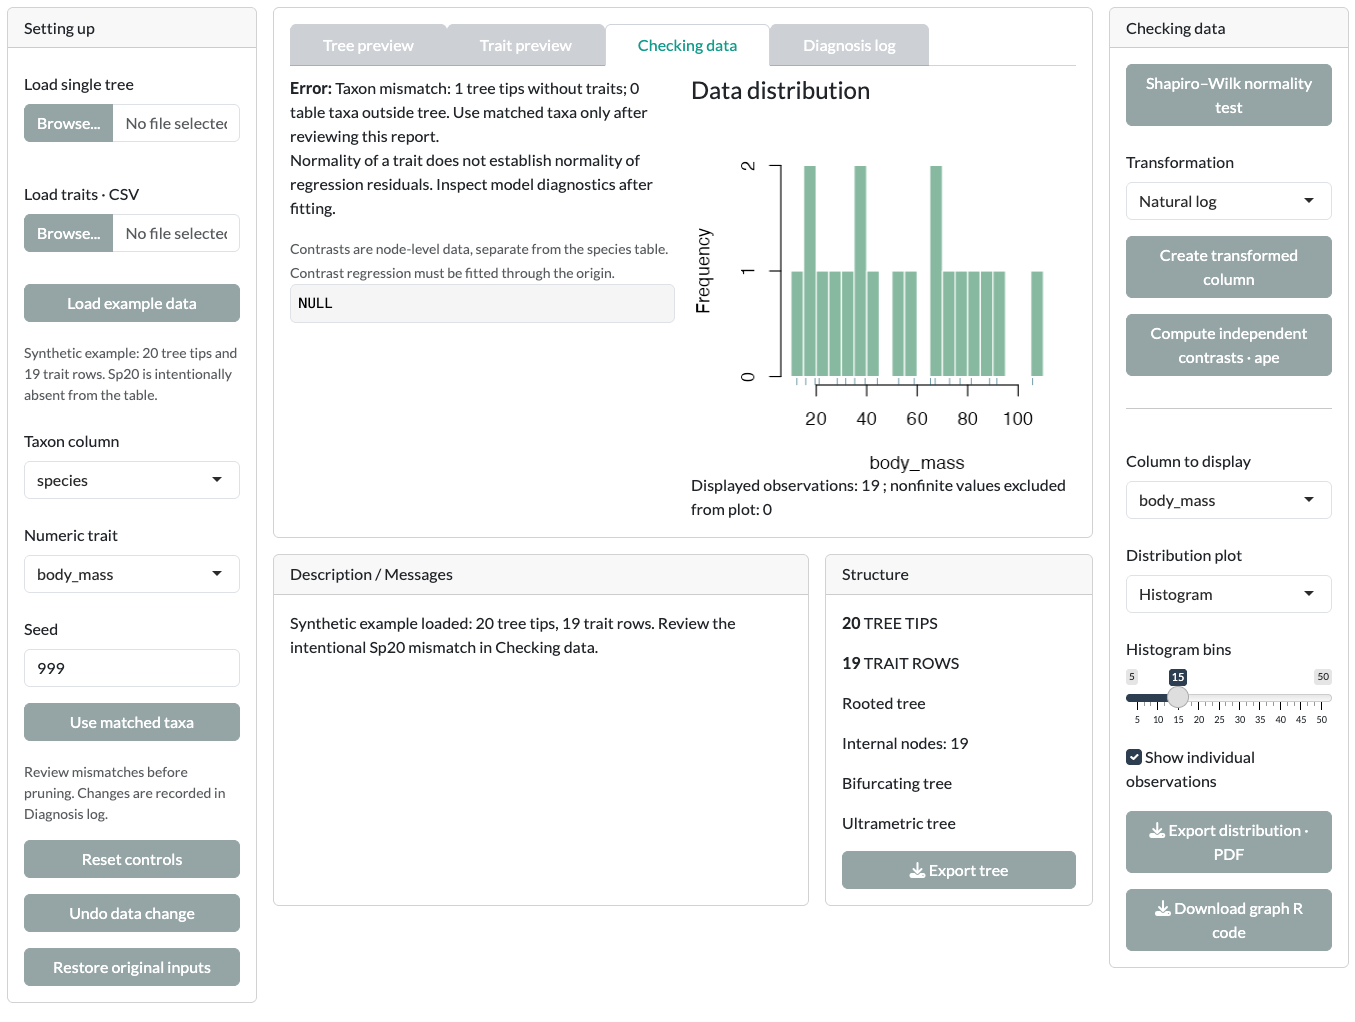
- Click Load example data. Description / Messages confirms 20 tree tips and 19 trait rows.
- Open Tree preview to see the tree. Use Graphic controls to change its layout or labels.
- Open Trait preview to see the table. It shows 25 rows by default; change Preview rows to see more. Analyses always use the whole table.
Resolve the mismatch
Analyses that combine a tree with traits reject mismatched data. You resolve it explicitly; Guane never prunes silently.
- Open Checking data. The report says there is a taxon mismatch: one tree tip without traits and no table taxa outside the tree. Description / Messages names
Sp20as the intentional mismatch. The report begins with “Error:”. This is expected; it blocks analyses until you match taxa. - Click Use matched taxa in the Setting up panel. Guane removes
Sp20from the working tree. - Open Diagnosis log. It records that
Sp20was excluded. Structure now shows 19 tree tips.
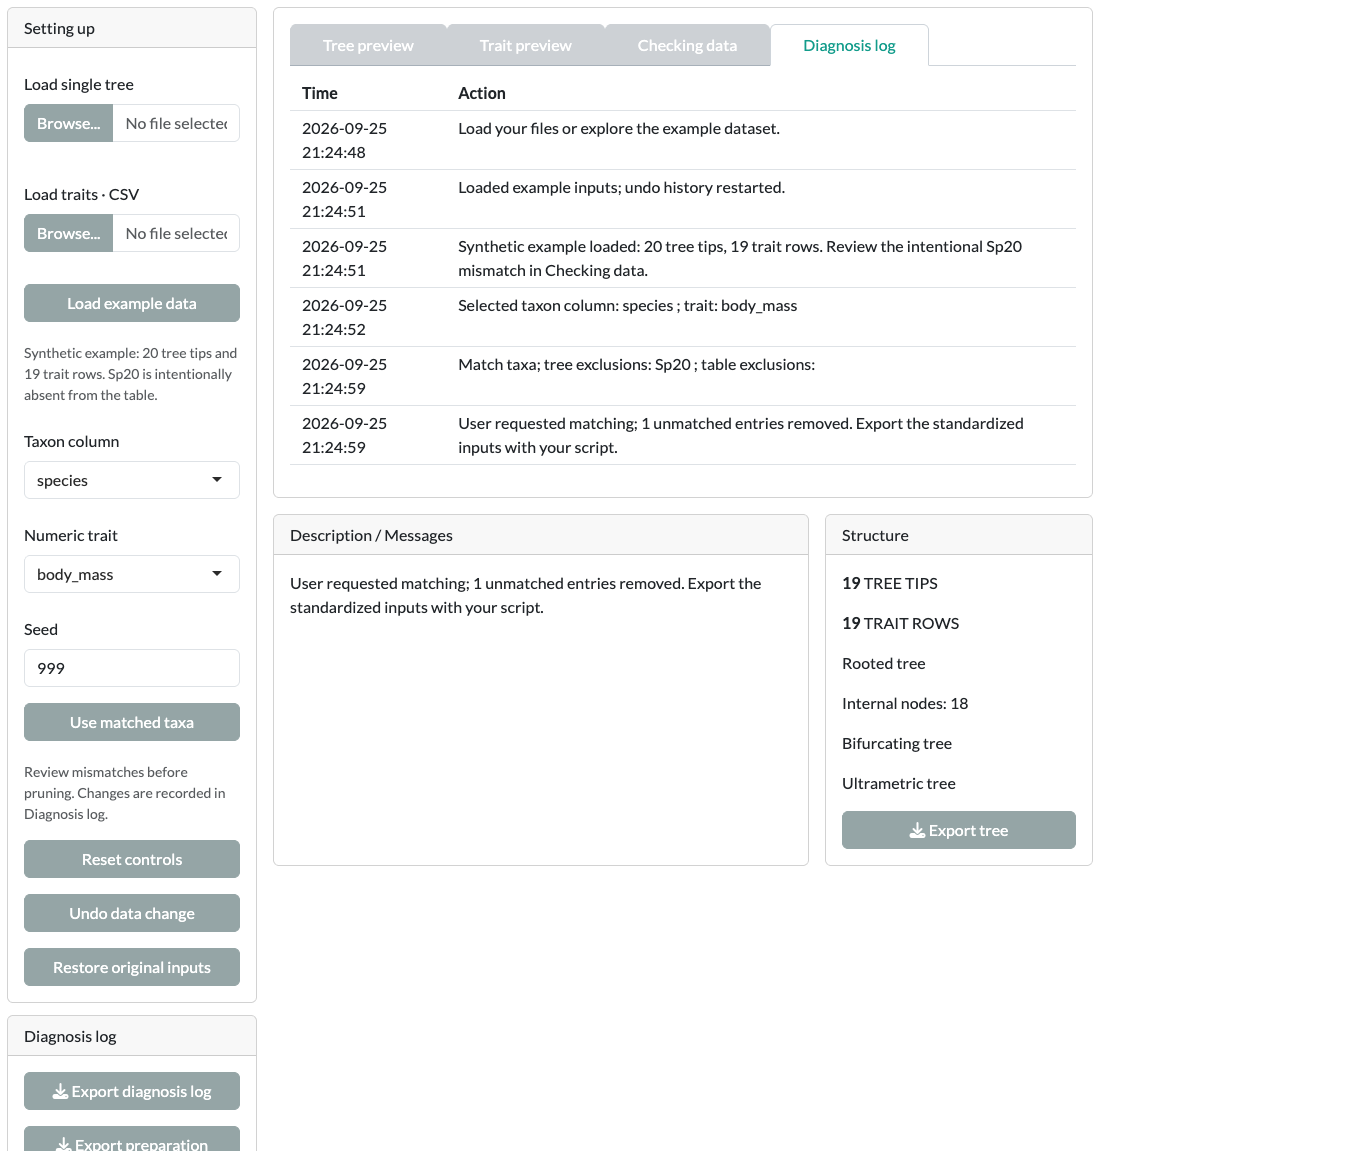
The original 20-tip tree is kept. Undo data change reverses the last preparation step. Restore original inputs returns to the files as loaded.
Each module has its own Data card. Load and match the example in every module where you use it. Tree-only cards, such as Lineage through time in Diversification, do not need matching.
Check and transform a trait
Checking data also helps you look at a trait before you model it.
- With Checking data open, make sure Numeric trait in the Setting up panel (left) is
body_mass. - Click Shapiro–Wilk normality test to test the selected column.
- Set Transformation to Natural log and click Create transformed column. Guane adds a new column,
body_mass_log. The originalbody_massstays unchanged. - Set Column to display to
body_mass_log. Choose a Distribution plot: histogram, density or normal Q–Q. - Optionally, click Compute independent contrasts · ape. Contrasts are node-level values, shown separately. They are not added to the species table.
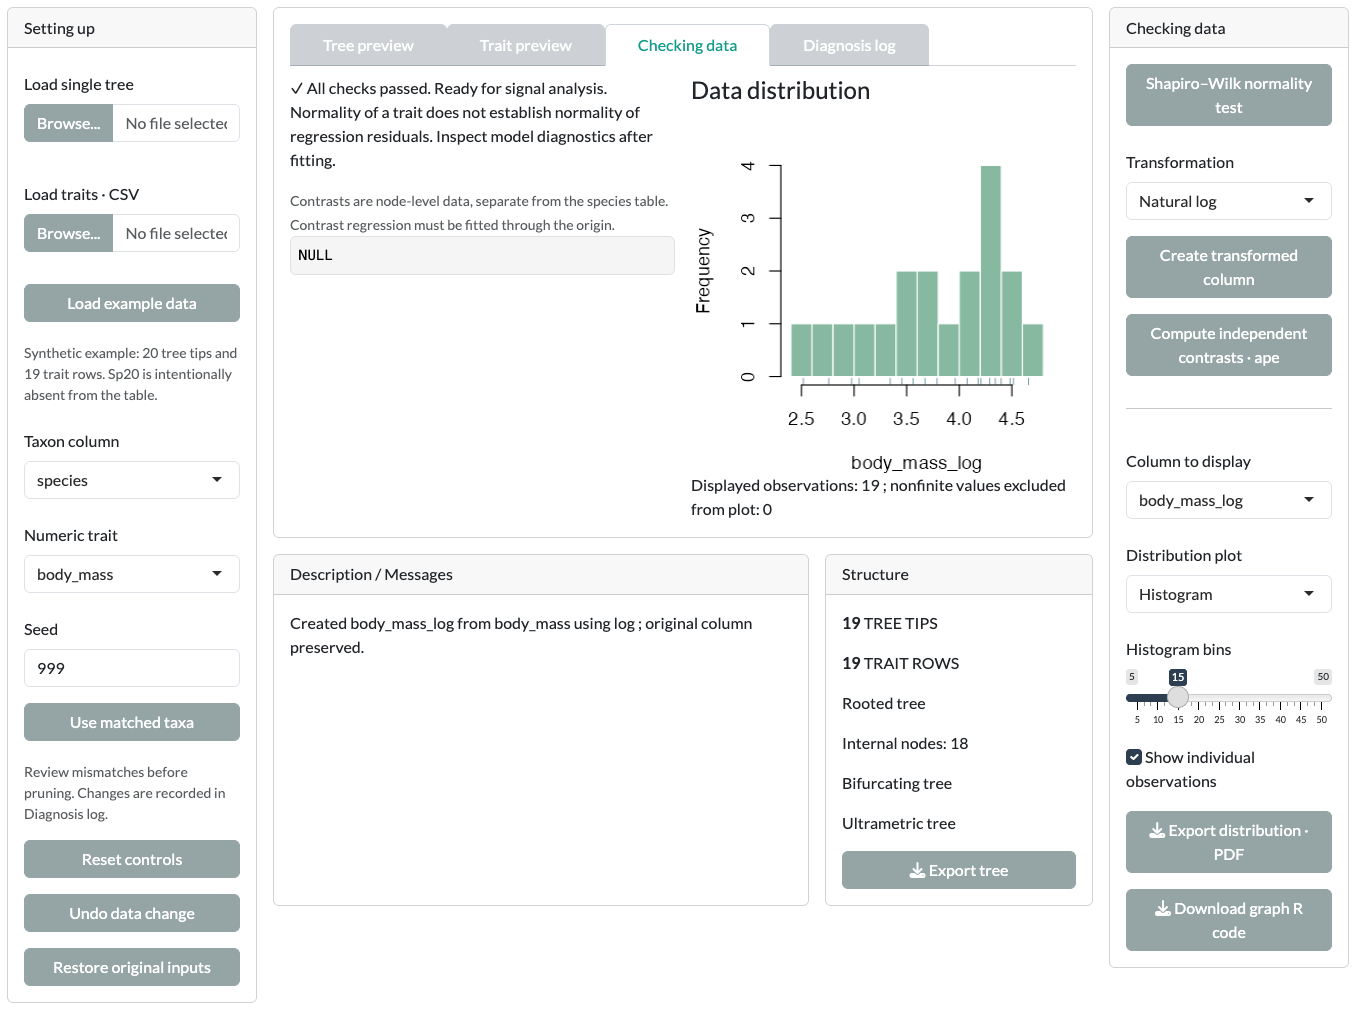
Other transformations are exponential, quadratic and reciprocal. Each one creates a new column.
A normal trait distribution does not mean a fitted model has normal residuals. Check each model’s Diagnostics tab after you fit it.
Save the preparation record
With Diagnosis log open, the left column offers Export diagnosis log and Export preparation script. With Trait preview open, Export traits saves the prepared table. See Exports and reproducibility.
Using your own data
In the Data card, upload one tree with Load single tree and one CSV with Load traits · CSV.
- The tree must be Newick (
.nwk,.tre) or Nexus (.nex,.nexus), with unique tip labels. - The CSV needs one header row and a unique taxon column. Taxon names must match tip labels exactly.
- Guane does not prune, impute, root, resolve polytomies or recalibrate a tree for you. Each method may add stricter requirements.
- Tree-only diversification cards do not need a CSV.
For exact formats, see Custom input formats.
Next step
Pick a tutorial: Phylo traits, Ancestral state reconstruction, Diversification or SSE models.