Interface tour
This page shows how Guane is organized. After it, you can find any card, run it and read its output. The tutorials assume you know this layout.
Module pills
The top bar holds the language menu. Below it, four pills select a module:
- Phylo traits: phylogenetic signal, PGLS, Pagel’s correlation and PGLM.
- Ancestral state reconstruction: continuous, discrete and polymorphic traits.
- Diversification: lineages through time and rate models.
- SSE models: BiSSE, MuSSE, QuaSSE and hidden-state models.
Inside a module, a second row of pills lists its cards. The first card is always Data.
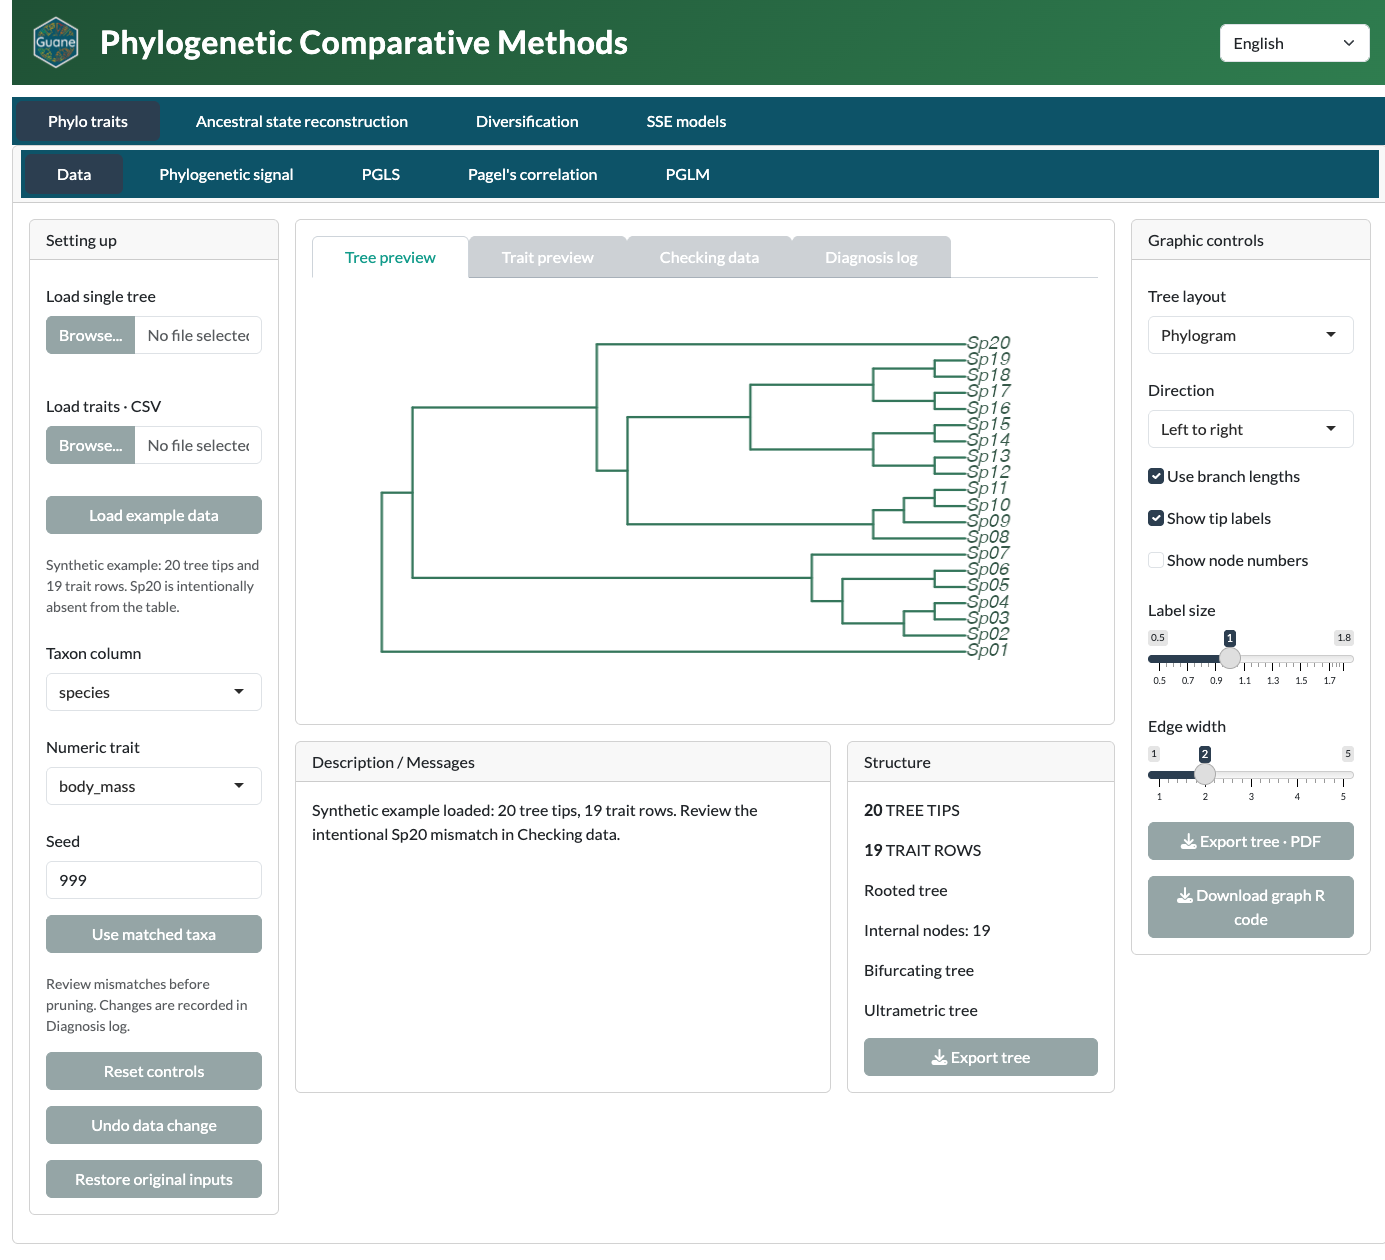
Each module has its own Data card
Every module keeps its own tree and trait table. Data you load in one module is not shared with the other three. When you switch module, load your data again in that module’s Data card.
The Data card has three columns:
- Left: the Setting up panel. Load a tree and a CSV, choose the Taxon column and Numeric trait, set the Seed, and use Use matched taxa, Undo data change or Restore original inputs. Reset controls clears the Data workspace.
- Centre: four tabs, Tree preview, Trait preview, Checking data and Diagnosis log. Below them, Description / Messages and Structure summarize the loaded data.
- Right: controls for the open tab. With Tree preview open, this is the Graphic controls panel. With Checking data open, it holds the transformation and distribution tools.
The Data card’s Seed makes the randomization test in the Phylogenetic signal card repeatable. Cards with other random steps have their own seed control, such as MCMC seed or Simulation seed.
Example data and the Data card walks you through each tab.
Anatomy of an analysis card
Every analysis card has the same layout.
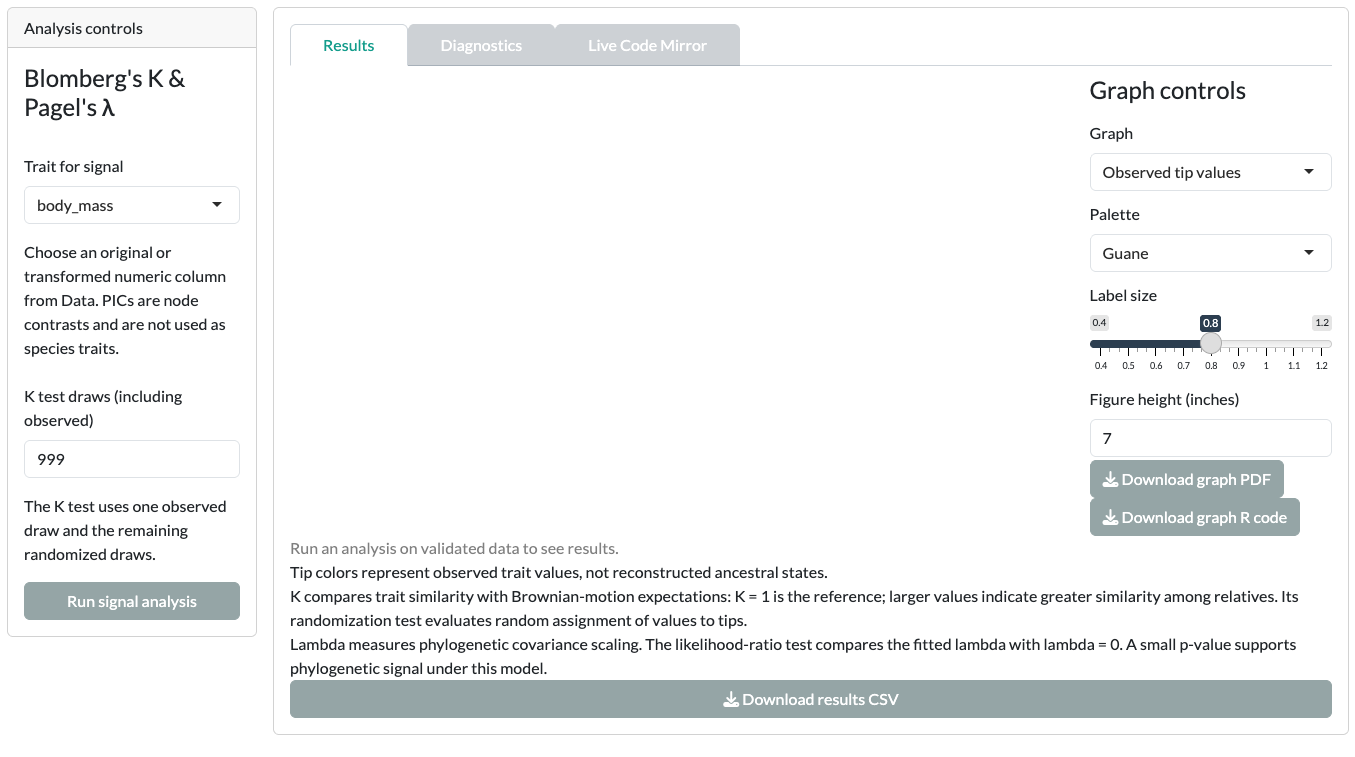
- Analysis controls (left): choose the trait or model settings, then click the card’s run button, for example Run signal analysis. Some cards group less common settings under Advanced fitting controls or Advanced analysis controls.
- Results tab: the graph, estimates and downloads. Before a run, it says “Run an analysis on validated data to see results.” The Graph controls column inside this tab changes which graph you see and how it looks. The ancestral state cards also have a Reset graph controls button.
- Diagnostics tab: warnings, optimizer checks and method-specific checks. Read it before you interpret Results.
- Live Code Mirror tab: the R code for the current analysis or its prepared settings. See Exports and reproducibility.
The Data card’s panel is called Graphic controls. Analysis cards call the same idea Graph controls. Both change appearance only.
What keeps or clears a result
Guane fits a model only when you click a run button. Cosmetic changes never refit.
| You change | What happens |
|---|---|
| Language | Data, selections and fitted results stay. |
| Palette, labels, figure size or other graph appearance | The fitted result stays; the graph redraws. |
| Data, trait selection or model settings | The affected result may be cleared. Click the run button again. |
Next step
Load the bundled example in Example data and the Data card.