Exports and reproducibility
A figure alone is not a full record of an analysis. This page lists what Guane exports and what to keep together when you report a result.
What each card exports
After a run, each analysis card offers downloads in its Results tab. Graph downloads sit under Graph controls; table downloads usually sit below the results table. The exact set depends on the card.
| Export | Typical label | What you get |
|---|---|---|
| Standalone R script | Download graph R code | A standalone R script. It embeds the prepared data, reruns the analysis where the card supports it, and redraws the selected graph. Open it in RStudio and click Source. Check the card’s Live Code Mirror text to see whether that card refits or only redraws. |
| Graph image | Download graph PDF, Download graph PNG | The current graph as a file. |
| Tables | Download results CSV and card-specific CSV downloads | Estimates, comparisons or diagnostics as CSV. |
| Saved result | Download graph settings and result RDS | The saved result and settings as an R object, where the card supports it. |
Some scripts need the scientific R packages that the card uses. Read the script header, and run it in an R session where those packages are installed.
Live Code Mirror
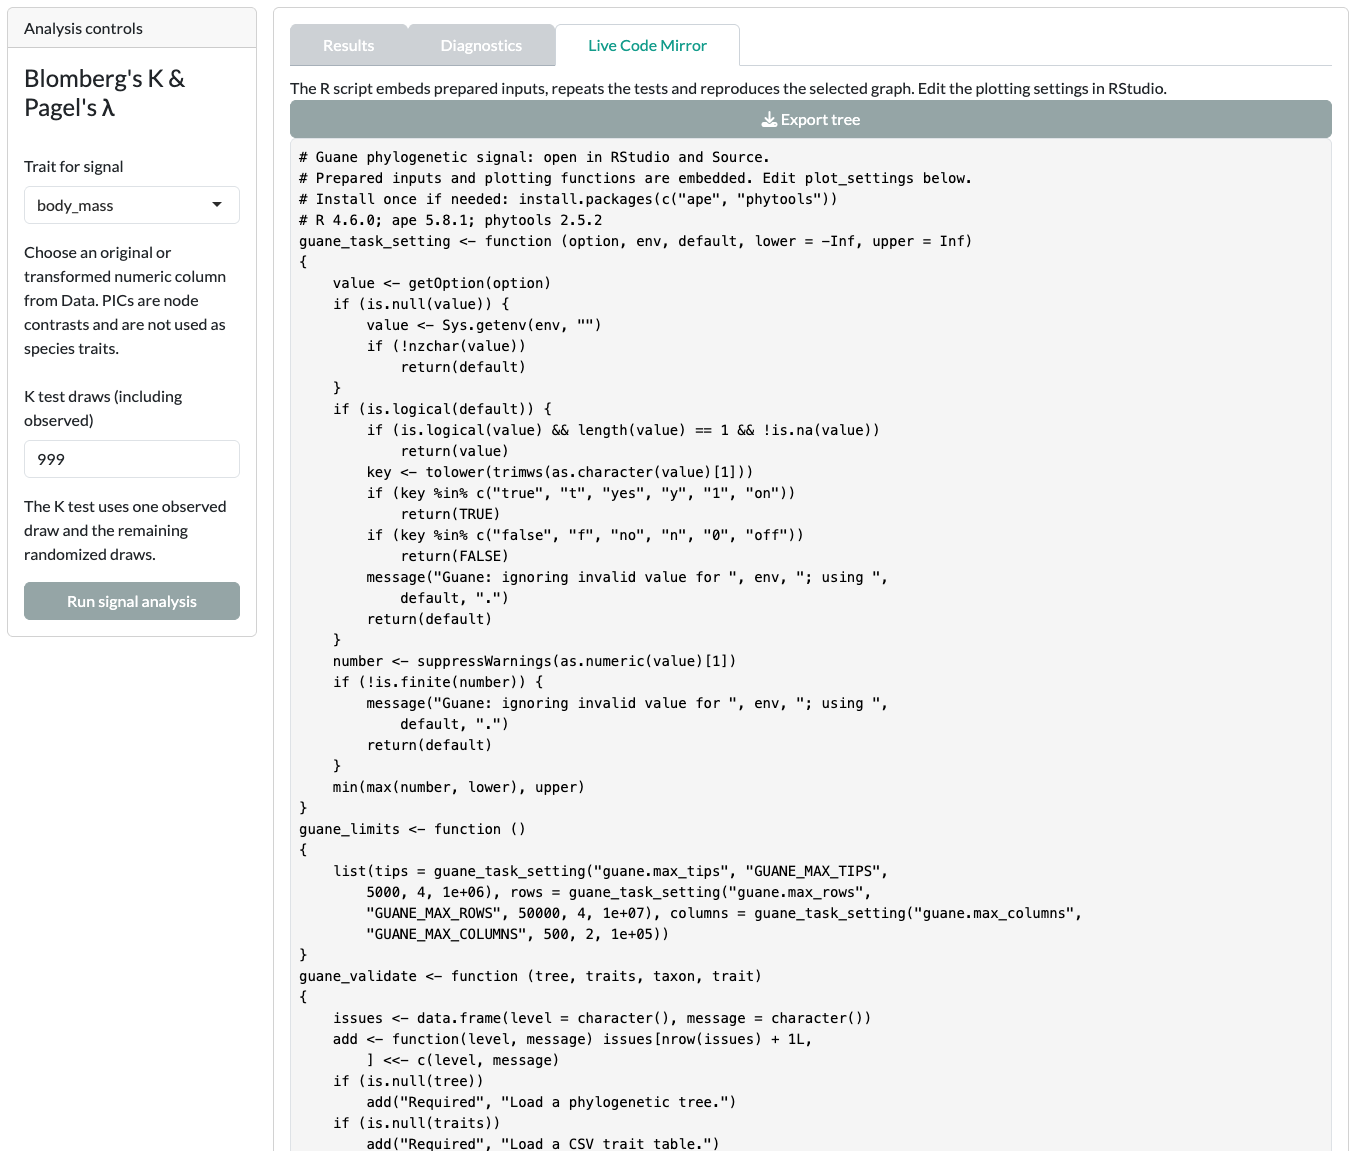
The Live Code Mirror tab shows R code for the current analysis. Before a run, it shows the prepared settings; after a run, it shows the code for the saved result.
The script starts with Guane’s helper functions; the analysis calls follow them. The tab has no download button. To save the script, use Download graph R code in Results.
Data preparation record
The Data card keeps an audit trail of what you did to your inputs.
- With Diagnosis log open: Export diagnosis log saves the log as CSV, and Export preparation script saves an R script that replays the preparation steps.
- With Trait preview open: Export traits saves the prepared trait table.
- With Tree preview open: Export tree · PDF saves the tree drawing, and Download graph R code saves its plotting code.
What to keep when reporting
Keep these together so another analyst can reproduce the saved graph and, where supported, rerun the fit:
- The tree and trait table you analysed, after preparation.
- The diagnosis log and preparation script.
- The card’s settings: method, engine, model, conditioning, starts, bounds, priors and seeds.
- Every diagnostic message and warning, including failed candidates and unresolved limits.
- The exported R script and the versions of Guane and the R packages it used.
- The interval type, its reference level, and what was held fixed.
The minimum information to report lists the full checklist.