Advanced phylo traits
The worked example shows what to do when λ cannot be estimated.
The bundled example is synthetic. Its values are invented and its branch lengths are arbitrary. Results are a demonstration, not biological evidence.
Before you start
Load the example in the Phylo traits Data card and click Use matched taxa. Resolve the mismatch shows each step. PGLS needs an ultrametric tree; the example tree is ultrametric. Pagel’s correlation and binary PGLM need two-state columns such as habitat_binary.
PGLS covariance
Initial or fixed parameter (rho / lambda / g)
Sets the starting value of the correlation parameter, or its fixed value when Keep correlation parameter fixed is ticked. It is ρ for Grafen, λ for Pagel and g for Blomberg; BM has none.
- Where
- PGLS Analysis controls Initial or fixed parameter (rho / lambda / g)
- Default
- 0.5, estimated (the box Keep correlation parameter fixed is off)
- Change it when
- The parameter will not estimate, as in the worked example below. Or you want to test one specific value, such as λ = 1. λ must lie between 0 and 1; ρ and g must be positive.
- Check after
-
The model line in Results names the fixed value, for example
lambda 1. A fixed λ of 1 is the same covariance as BM, so it tells you nothing new about λ.
Estimation method
Chooses REML or ML for the PGLS fit.
- Where
- PGLS Analysis controls Estimation method
- Default
- REML
- Change it when
- You want to compare likelihoods or AIC across fits with different fixed effects. Use ML for that. Compare covariance models (ML) always refits by ML.
- Check after
- Only compare log-likelihoods and AIC between fits that both used ML.
Pagel’s correlation search
Optimization starts
Sets how many starting points the optimizer tries for each model.
- Where
- Pagel’s correlation Analysis controls
- Default
- 3 (range 1–5)
- Change it when
- Attempts disagree, or you want more assurance of the best fit.
- Check after
- The Optimization attempts table in Diagnostics. “Convergence code 0 is required.”
Maximum rate per branch-length unit
Sets the upper bound on every transition rate.
- Where
- Pagel’s correlation Analysis controls
- Default
- 100
- Change it when
- A fitted rate sits at the bound, or your branch-length units make 100 unrealistic.
- Check after
- “A fitted rate is at or near a boundary. Inspect sensitivity to the rate bound and initial values.”
PGLM estimation and coding
Estimation method
Chooses the phylolm::phyloglm estimator for a binary response.
- Where
- PGLM Response family Binary (Bernoulli / logit) Estimation method
- Default
-
logistic_MPLE(the alternative islogistic_IG10) - Change it when
- The fit warns that alpha is near its boundary, and you want to check whether the coefficients depend on the estimator.
- Check after
- “Alpha is near its optimization boundary; inspect sensitivity before inference.”
Categorical predictors
Marks predictors as categories. Guane then shows a Reference category picker for each one.
- Where
- PGLM Analysis controls Categorical predictors
- Default
- Empty; every predictor is treated as continuous
- Change it when
- A predictor is a category, including a category coded with numbers. Pick the reference category you want the other categories compared against.
- Check after
- The Diagnostic screens table (LargeResidual, Sparse, OneOutcome), and “Some predictor categories contain fewer than three taxa; estimates may be unstable.”
Worked recipe
Worked example: when λ cannot be estimated
Start in the PGLS card, with the example matched in the Data card.
- Set Response to
body_lengthand Predictors tobody_mass. - Set Correlation structure to Pagel and Estimation method to ML.
- Click Run PGLS. Expect no result: the status reports
false convergence (8). The optimizer could not estimate λ. - Set Initial or fixed parameter (rho / lambda / g) to
1and tick Keep correlation parameter fixed. - Click Run PGLS again. The status reads “PGLS completed. Review residual diagnostics and fit warnings.” The model line ends with
lambda 1. - Click Compare covariance models (ML). With λ and g fixed at 1, BM, Pagel and Blomberg give the same log-likelihood. They are the same covariance.
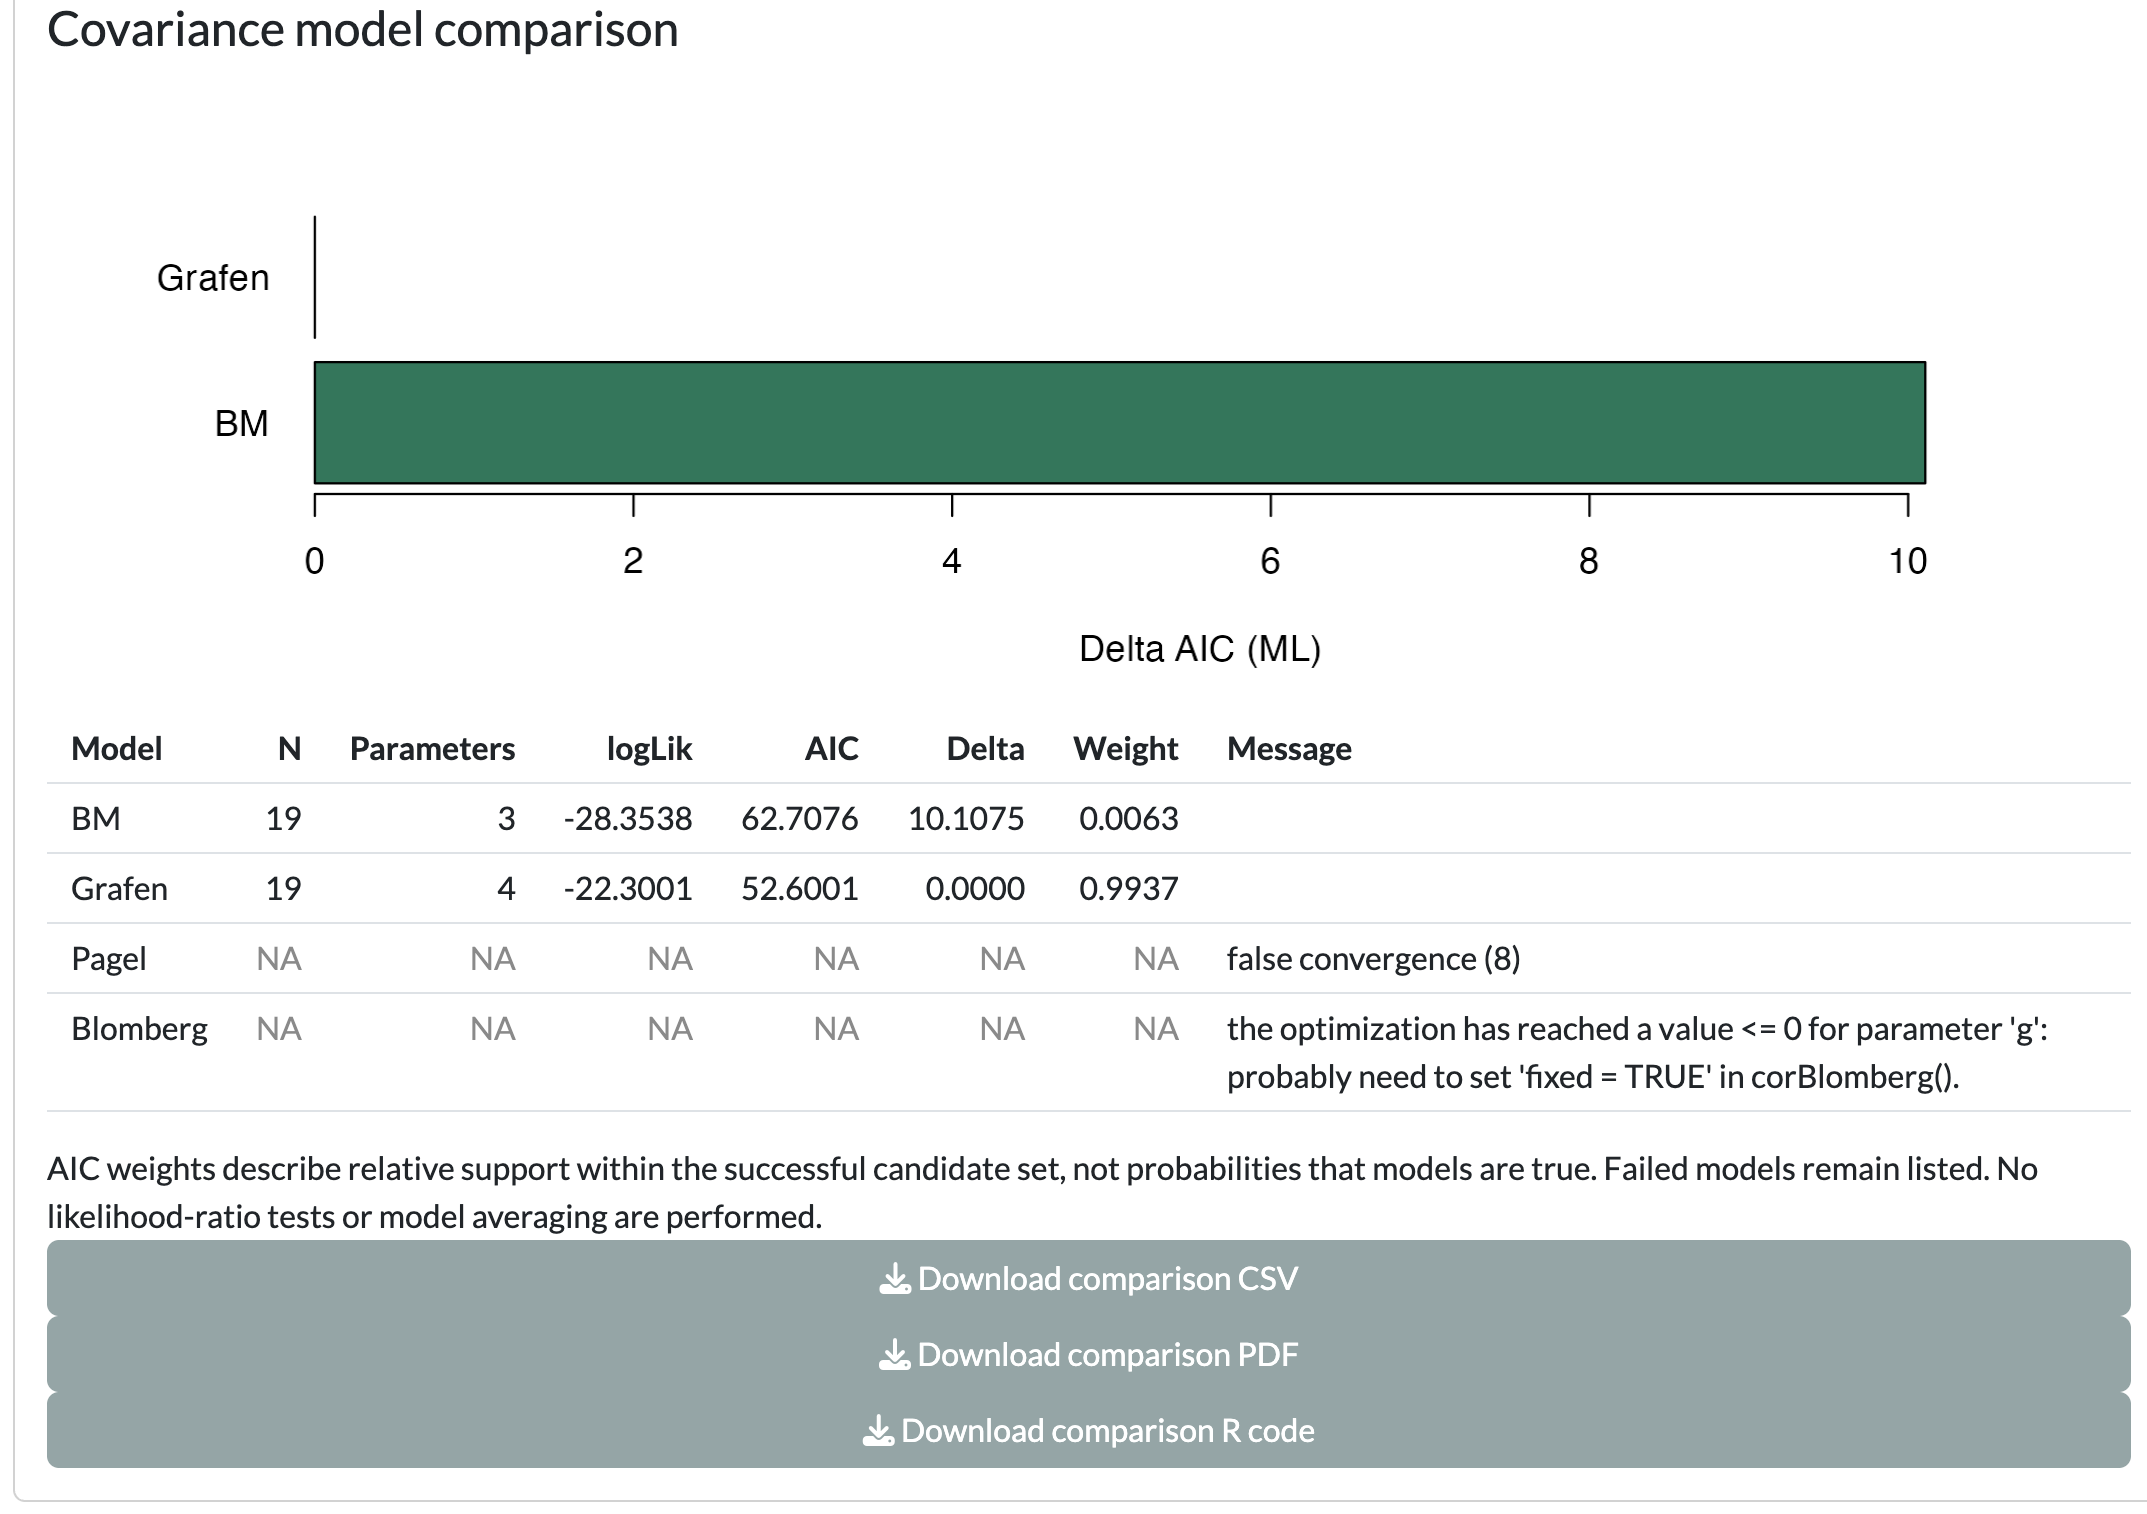
- Untick Keep correlation parameter fixed, set Initial or fixed parameter (rho / lambda / g) back to 0.5, and click Compare covariance models (ML) again. The status reads “Comparison finished. Review failed models and warnings.”
In the second comparison, only BM and Grafen fit, and Grafen takes almost all the weight. The Pagel row fails with false convergence (8), and the Blomberg row fails with an optimizer message about g. The weights compare only the two structures that fit. They do not show that λ or g was tested and rejected. If you leave the value at 1, the Pagel row fails differently (“Estimated lambda is outside the supported interval [0, 1]. Try a fixed value or another structure.”) and the Grafen row carries the message “Non-positive definite approximate variance-covariance”.
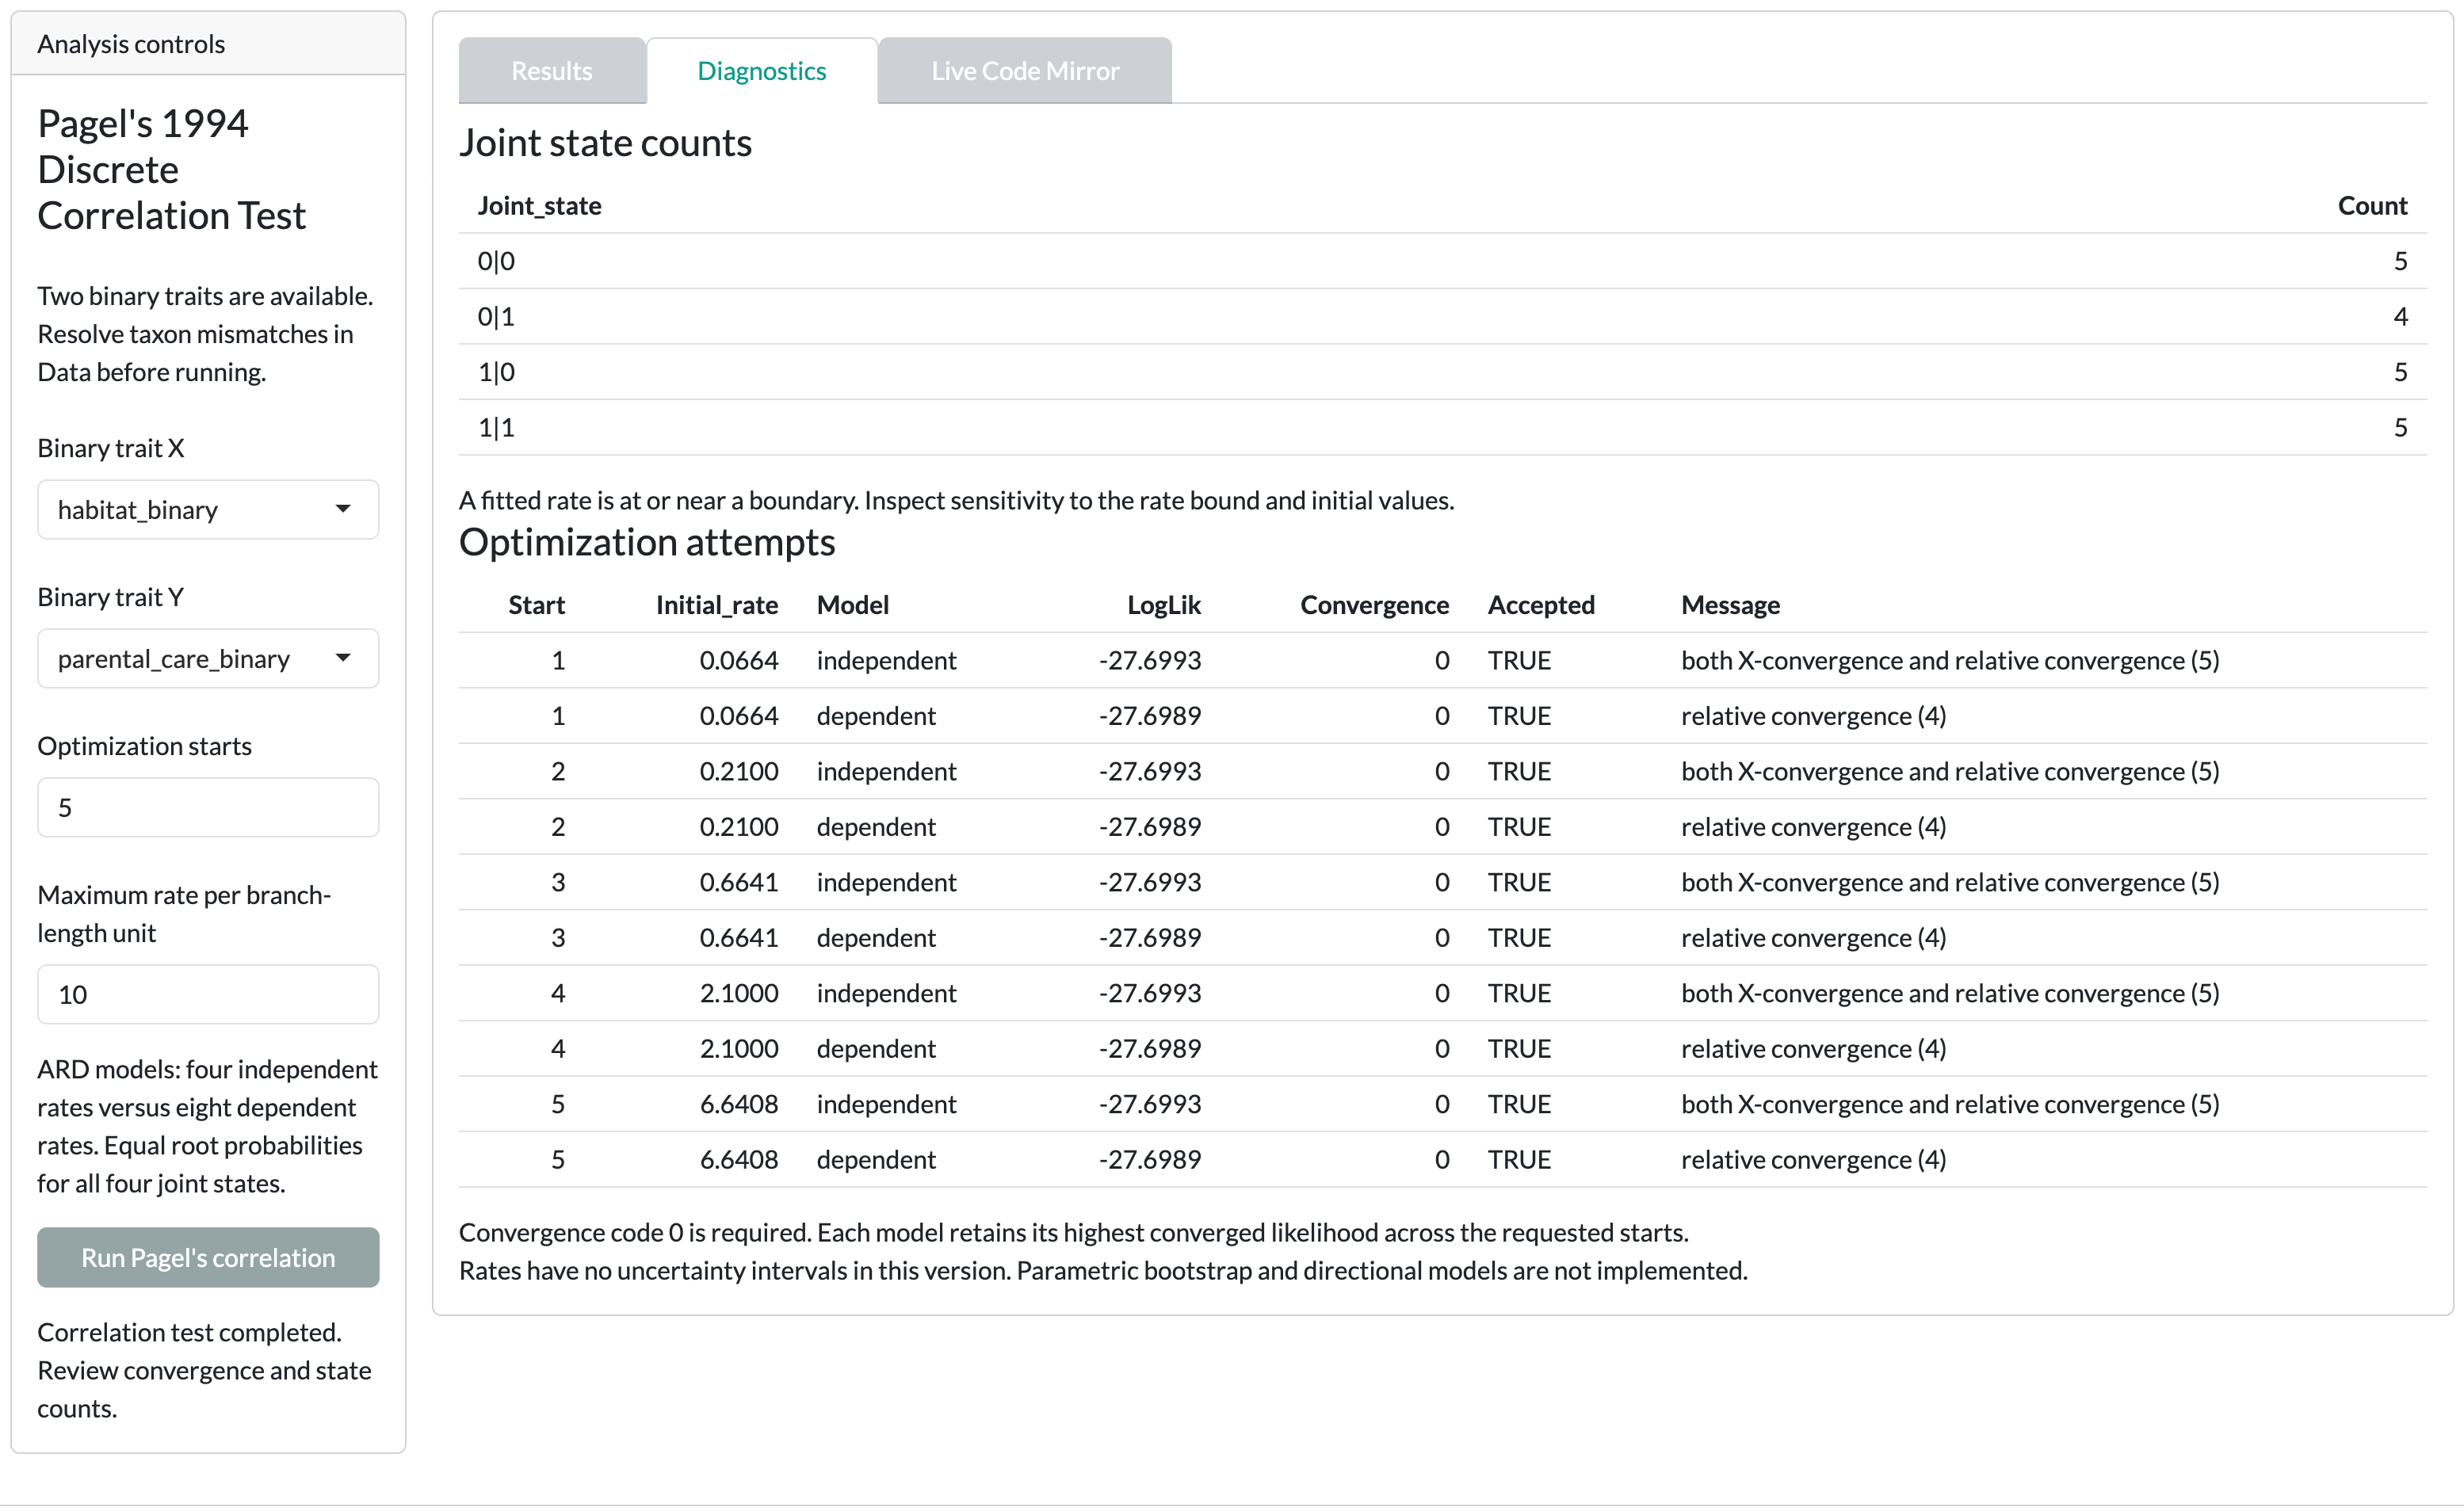
A shorter check on the Pagel’s correlation card: set Optimization starts to 5 and Maximum rate per branch-length unit to 10, then run. Expect every attempt to converge, the two models to reach nearly the same likelihood, and the boundary warning to appear.
Before you interpret
- A failed fit is a result. Do not drop the failed rows and read the remaining weights as a test of λ or g.
- Fixing a parameter answers a narrower question than estimating it. Report which parameters you fixed.
- Compare likelihoods only between ML fits on the same data.
Read Phylogenetic signal and PGLS and Pagel’s correlation and PGLM before you report.