Advanced diversification
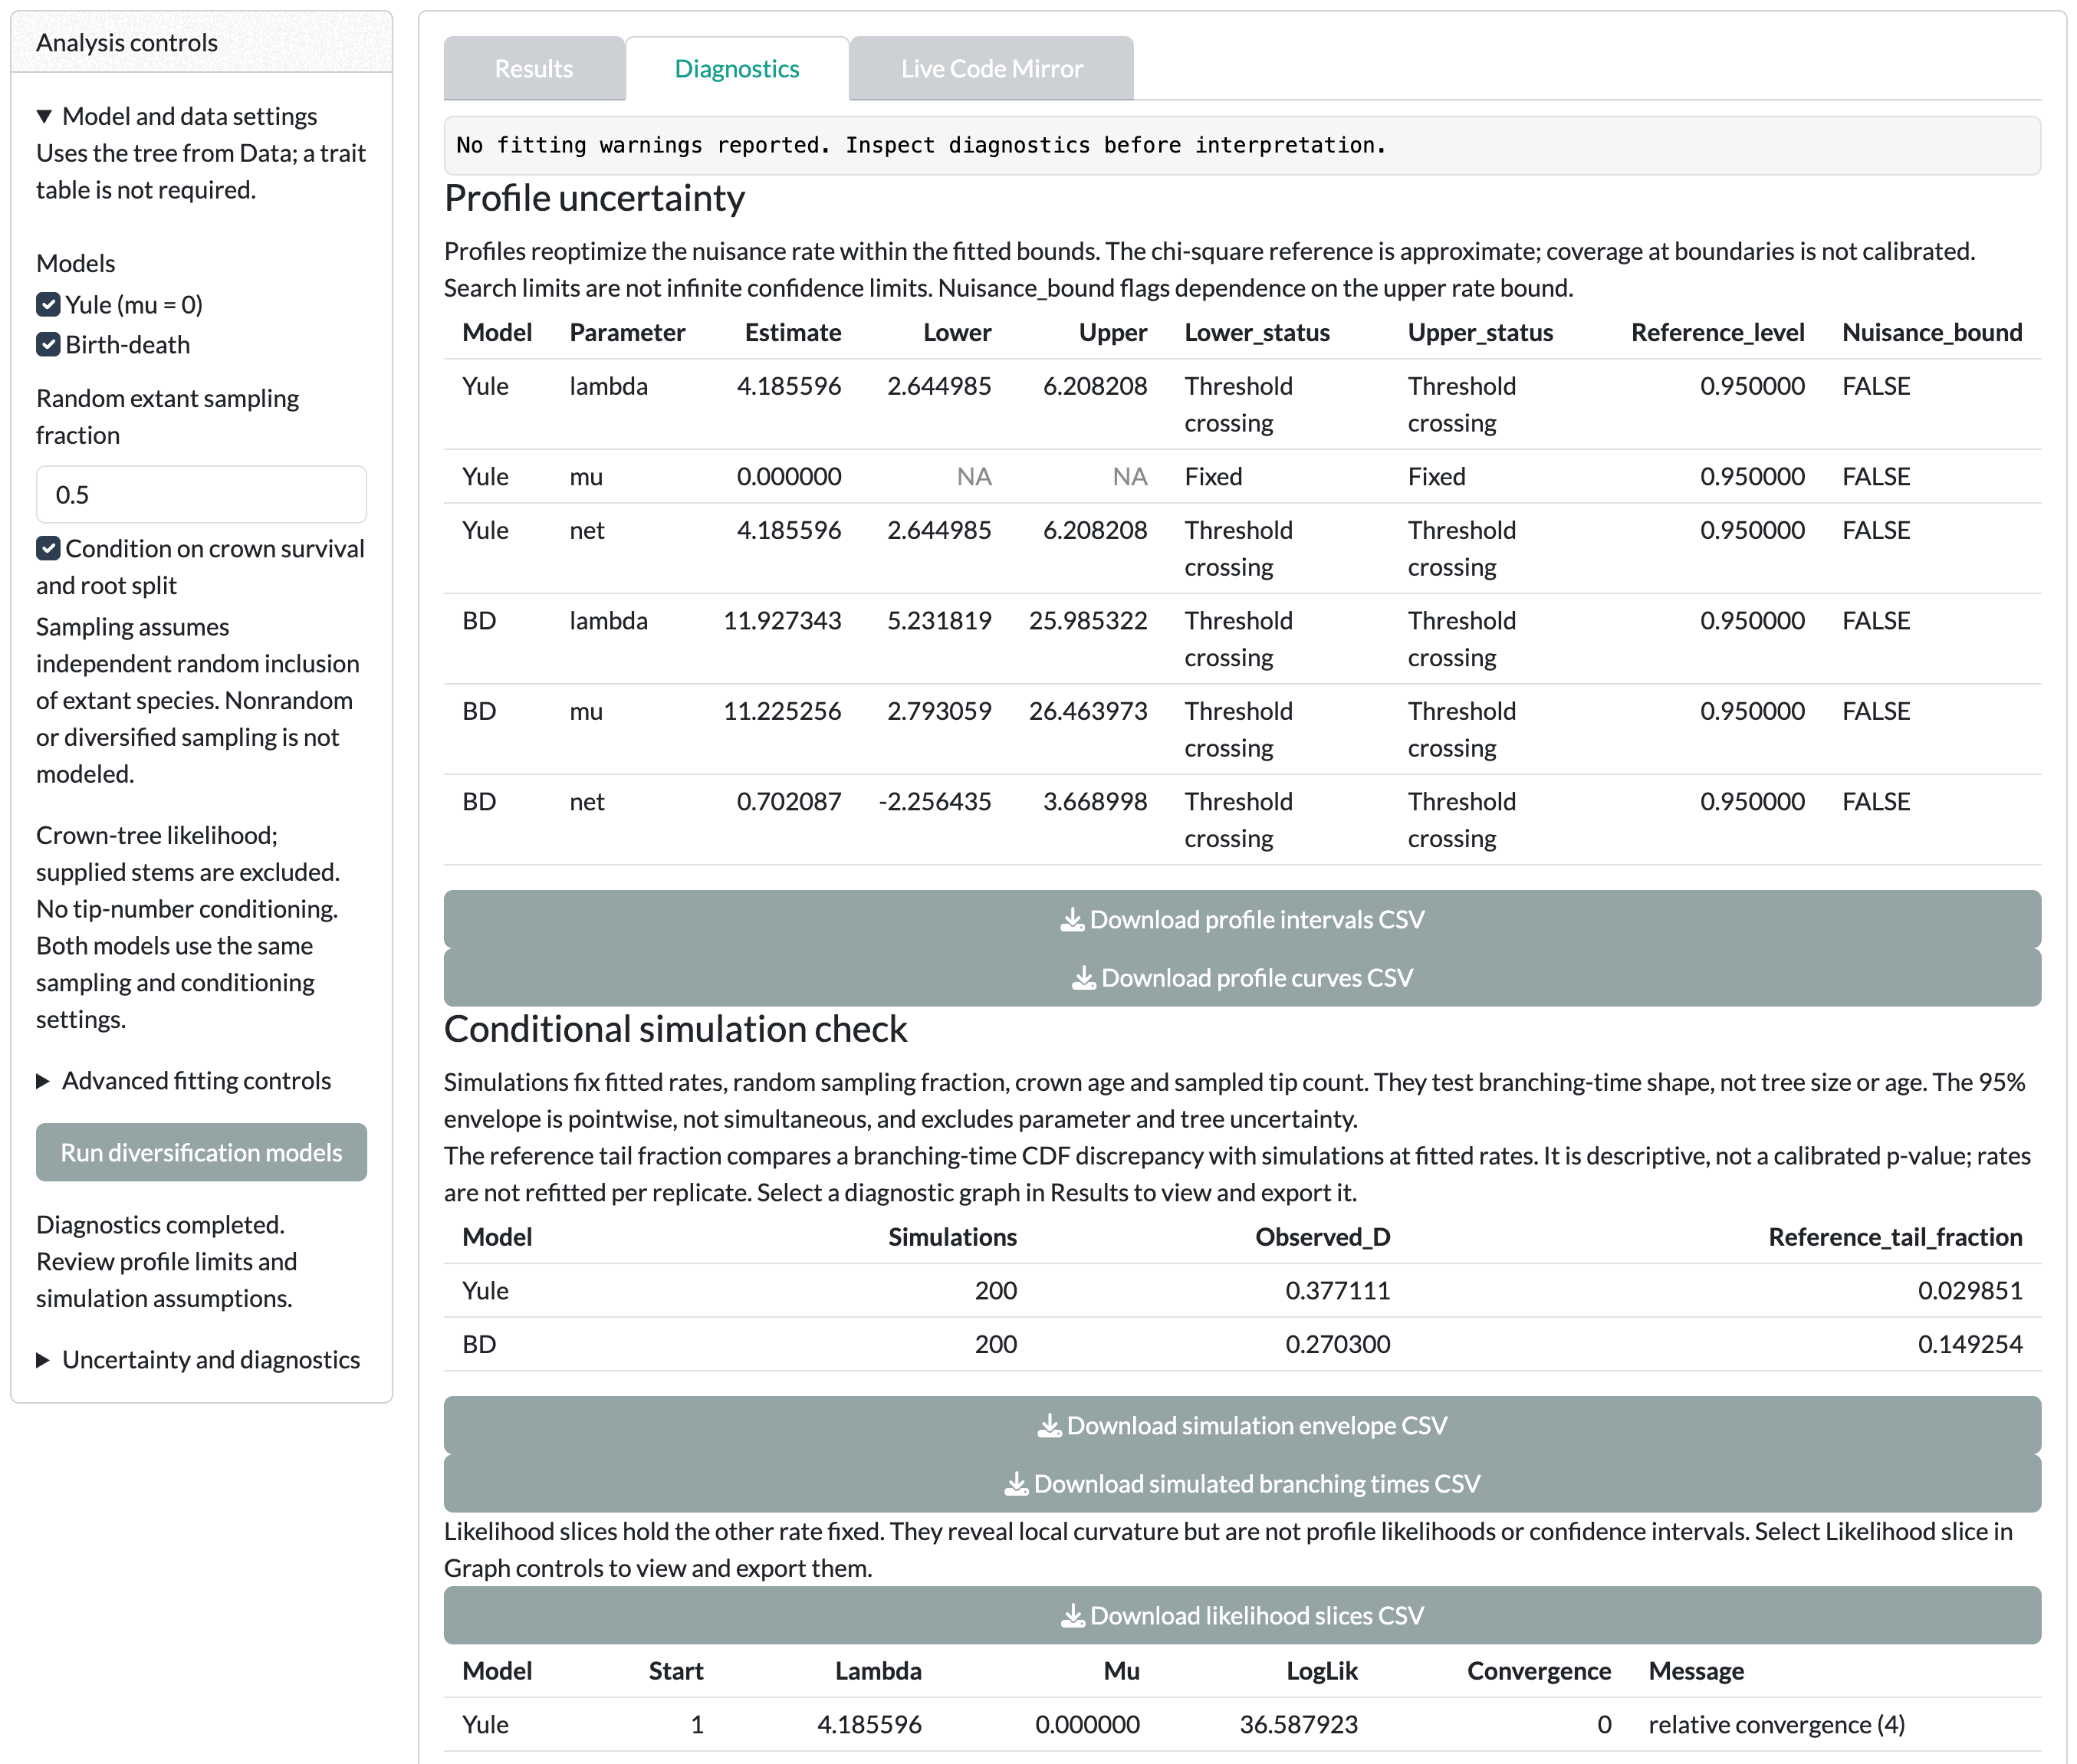
The worked example shows a net diversification interval that spans zero.
The bundled example is synthetic. Its branch lengths are in arbitrary units, not ages. Rates are per branch-length unit. Results are a demonstration, not biological evidence.
Before you start
Load the example in the Diversification Data card. These cards use the tree only, so you do not need to match taxa. Each rate card groups its controls in three collapsible sections: Model and data settings (open), Advanced fitting controls and Uncertainty and diagnostics.
Sampling and bounds
Random extant sampling fraction
The share of living species in the clade that your tree includes.
- Where
- Constant-rate models Model and data settings Random extant sampling fraction
- Default
- 1 (complete sampling); range above 0 up to 1
- Change it when
- Your tree is missing species. The fraction assumes every living species had the same chance of inclusion; nonrandom sampling is not modeled. Set it to the number of tips in your tree divided by the number of living species in the clade, from a current taxonomy. If missing species cluster in particular clades, the random-sampling assumption fails; use Clade sampling fractions (CSV) in Clade-specific models. Rerun at 1 and at your value to see how much it matters.
- Check after
-
The model line in Results shows
sampling.f. A value out of range stops with “Sampling fraction must be greater than zero and at most one.”
Rate upper bound (blank = 100 / crown age)
Sets the largest speciation or extinction rate the optimizer may try.
- Where
- Constant-rate models Advanced fitting controls Rate upper bound (blank = 100 / crown age)
- Default
- Blank: 100 divided by the crown age
- Change it when
- A rate sits at the bound. Raise the bound and refit to see whether the estimate moves.
- Check after
-
The
Boundarycolumn of the optimizer table in Diagnostics, andNuisance_boundin the profile table.
Initial lambda (blank = derived)
Sets the optimizer’s starting speciation rate. Initial mu (blank = lambda / 2) sets the starting extinction rate.
- Where
- Constant-rate models Advanced fitting controls
- Default
- Blank: lambda is derived from the tree; mu is half of lambda
- Change it when
- Starts reach different likelihoods, and you want to test a specific region of the parameter space.
- Check after
- “Optimizer starts reached different likelihoods; a global optimum is not guaranteed.” Starts outside the bounds stop with “Starting rates must lie inside the selected rate bounds.”
Uncertainty checks
Calculate profile likelihoods
Computes a profile likelihood interval for each rate, including net diversification.
- Where
- Constant-rate models Uncertainty and diagnostics Calculate profile likelihoods
- Default
- On, with Profile reference level 0.95 and Profile grid points 61
- Change it when
- You need finer intervals (more grid points) or a different reference level.
- Check after
-
The
Lower_statusandUpper_statuscolumns in Diagnostics.Threshold crossingmeans the interval closed.Physical boundaryorSearch limit reachedmeans the interval is open on that side.
Simulate conditional LTT curves
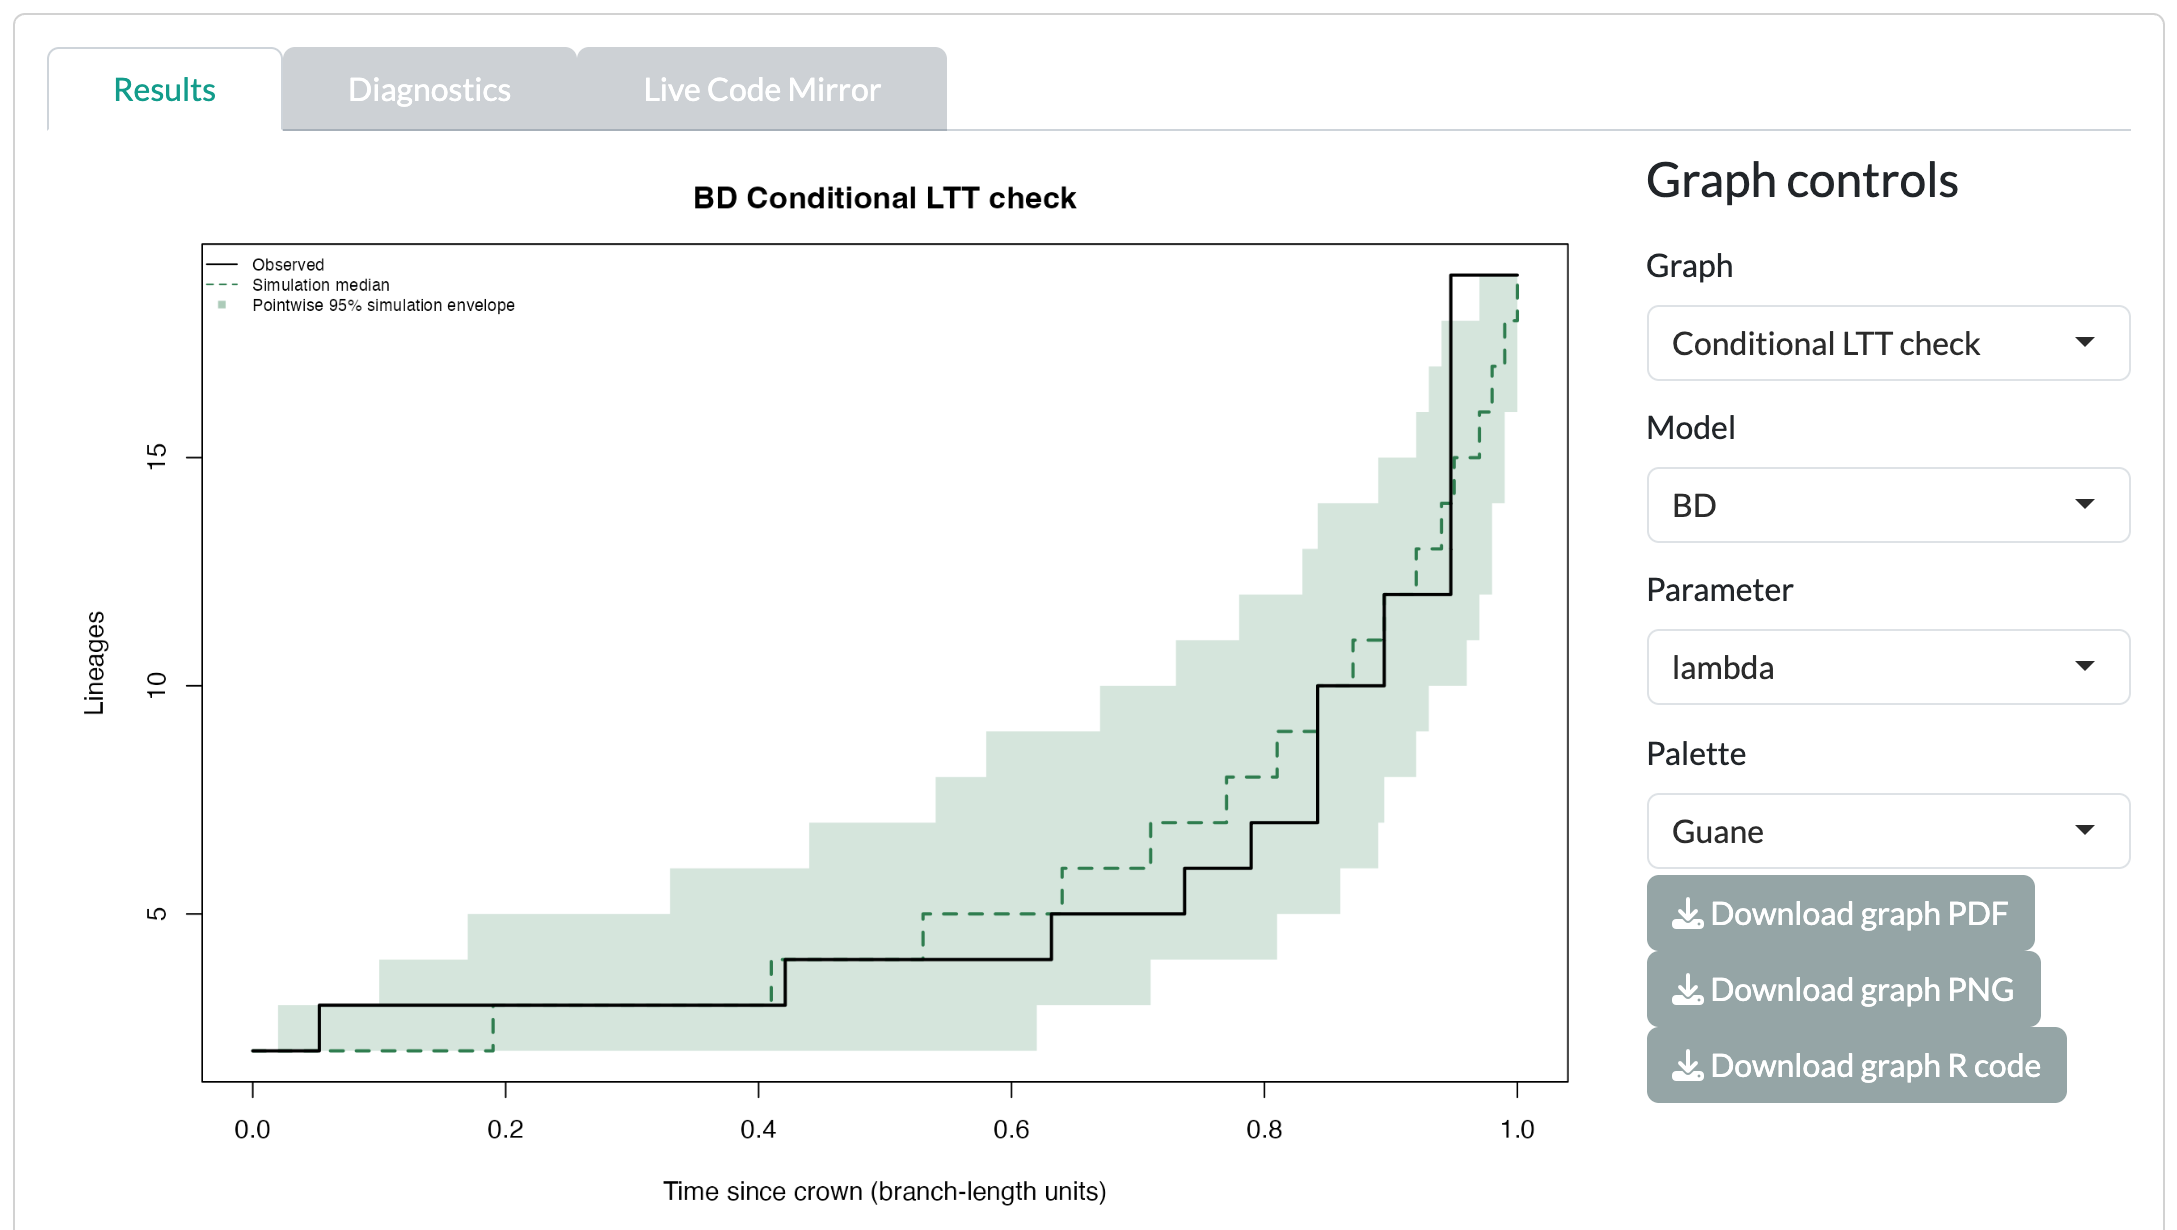
Simulates trees under each fitted model and compares their LTT curves with the observed tree.
- Where
- Constant-rate models Uncertainty and diagnostics Simulate conditional LTT curves
- Default
- On, with Simulation replicates 200 and Simulation seed 999
- Change it when
- You want a more stable check (more replicates) or a repeatable one (fixed seed).
- Check after
-
The Conditional simulation check table in Diagnostics.
Reference_tail_fractionis descriptive, not a p-value. Set Graph to Conditional LTT check to see the envelope.
Clades and diversity dependence
Clade sampling fractions (CSV)
Gives each selected clade its own sampling fraction.
- Where
- Clade-specific models Model and data settings
- Default
- Empty: complete sampling (1) for every clade. Fill sampling table writes a template.
- Change it when
- Clades are sampled unevenly. See the clade sampling format.
- Check after
- Each clade’s fit in Results. Compare models within a clade only.
Missing extant species
The number of living species missing from the tree, for diversity-dependent models.
- Where
- Diversity-dependent models Model and data settings
- Default
- 0
- Change it when
- Your tree is incomplete. This is a count, not a sampling fraction.
- Check after
- The bootstrap needs complete sampling: “Bootstrap requires complete sampling and crown-survival conditioning (cond = 1).”
Two other cards take pasted tables. For custom rate sharing in Joint clade-dependent models, see the custom joint constraints format. The time-varying robustness checks run with Run time-model uncertainty; see time-varying models for their limits.
Worked recipe
Worked example: incomplete sampling, profiles and a simulation check
Start in the Constant-rate models card, with the example tree loaded in the Data card.
- Keep both Yule (mu = 0) and Birth-death under Models.
- Set Random extant sampling fraction to
0.5. This invented value assumes the tree holds half the living species. - Click Run diversification models. The model line shows
sampling.f = 0.5. - Open Uncertainty and diagnostics. Set Simulation replicates to 200 and Simulation seed to 42.
- Click Run uncertainty and diagnostics. The status reads “Diagnostics completed. Review profile limits and simulation assumptions.”
- In Diagnostics, read the profile table and the Conditional simulation check.
Expect birth-death to have the lowest AIC, with extinction almost as high as speciation. Every estimated rate’s profile limits show Threshold crossing. The net diversification interval spans zero, so the data cannot tell growth from decline. The high extinction reflects an evenly spaced synthetic tree and an invented sampling fraction.
To see how much the sampling fraction matters, set it back to 1. This clears the whole fit: the status reads “Inputs changed. Run diversification models to update results.” Click Run diversification models, then Run uncertainty and diagnostics, and compare the two runs. Changing only a setting in Uncertainty and diagnostics keeps the fit and clears just the diagnostics (“Diagnostic settings changed. Run uncertainty and diagnostics again.”).
Before you interpret
- A sampling fraction is an assumption you supply. Report it, and check how much results change with it.
- An interval that spans zero does not show positive or negative net diversification.
- Extinction estimated from a small tree of living species is very sensitive to assumptions.
Read LTT and whole tree diversification, Clade dependent diversification and Diversity dependent diversification before you report.